






| TL;DR A keyword at 10,000 searches growing 20% month over month is usually a better target than one at 20,000 standing still.The same term reads differently over a 30-day window than a 12-month average. Tools rarely say which you are looking at.5,000 searches is huge in Germany and tiny in the US. Volume without a market attached is not a number.Ten keywords at 500 volume you can win beats one at 5,000 you cannot. Short version: volume is a size reading. Size is the least decision-relevant thing about a keyword. |
Six hundred people a month search the phrase “amazon search volume,” which tells you the metric matters to sellers and nothing about how they should use it. That is a fair illustration of the problem with the metric itself.
Search volume is the first number every keyword tool shows and the one most likely to be read as a verdict. It is not a verdict. It is one of four readings, and taken alone it reliably points at the terms hardest to win.
What the Number Is Actually Measuring
Volume estimates how many times a phrase was searched in a marketplace over a period. Three things about that sentence do more work than they appear to.
It is an estimate. No third-party tool has Amazon’s query logs. Every figure is modeled, and models carry error bars that the interface almost never shows. A stated volume figure is a modeled output, not a measurement, and the good tools say so.
It counts searches, not searchers. One person checking a term nine times over a week contributes nine.
It is bounded by a window. Which brings us to the reading most often got wrong.
Window: The Same Keyword, Two Different Numbers
A 30-day window and a 12-month average describe the same keyword and produce different figures, sometimes by multiples. Neither is wrong. They answer different questions.
The 30-day window answers “what is happening now,” which is the right question for inventory and bid decisions. The 12-month average answers “what is normally true,” which is the right question for whether to launch a product at all.
Sellers get burned when they read a 30-day figure taken during a seasonal peak as though it were the annual norm, order stock against it, and discover in February that the peak was the number. The reverse error is quieter and just as expensive: reading a 12-month average during a rising trend and under-ordering.
A useful discipline is to look at both and note the gap. A term whose 30-day figure sits well above its 12-month average is either seasonal or growing, and those need opposite responses.
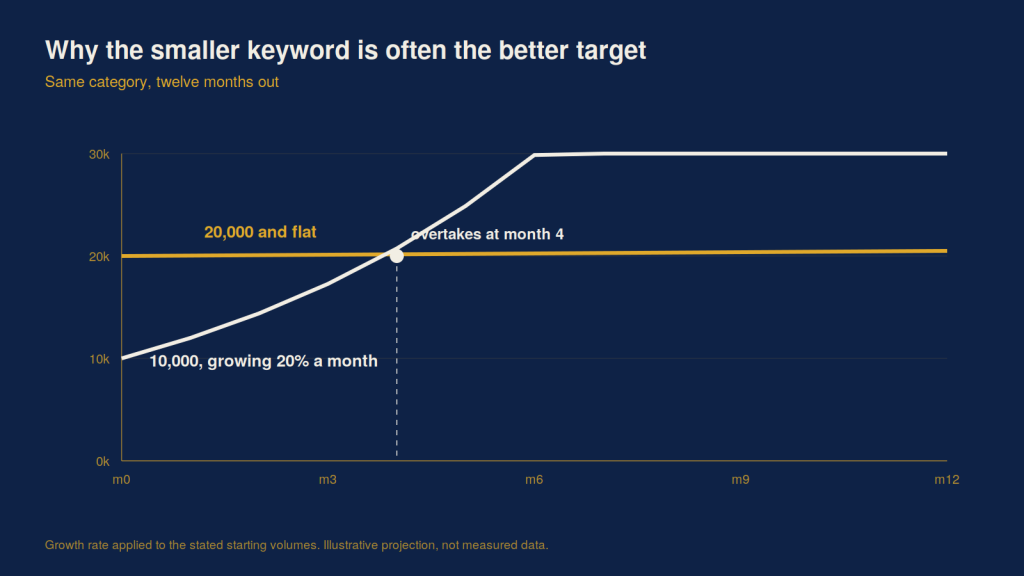
The smaller term overtakes the larger one inside a year, and costs far less to rank for while it does.
| Reading | Question it answers | Decision it should drive |
| 30-day window | What is demand doing right now | Bids, restock timing |
| 12-month average | What is normally true | Whether to enter the category |
| Direction of travel | Is it rising or decaying | Whether to build around it |
| Relative rank in market | Is this figure big for this country | Whether the number means anything |
Direction Beats Size
This is the reading that changes decisions most and appears in tools least.
A keyword pulling 10,000 searches a month and growing 20% month over month is generally a better target than one pulling 20,000 and flat. The smaller term is on its way to being the larger one, competition for it has not yet arrived, and the cost of ranking today is a fraction of what it will be after it doubles.
Seasonality is the same reading on a longer axis. The question is not whether a term peaks but how early it starts to move. If volume begins rising two months before the peak, that is your inventory lead time telling you when to order, and it is visible in the data long before it is visible in sales.
Volume Without a Market Is Not a Number
Five thousand searches in Germany is a large term. Five thousand in the US is a rounding error. The figure is identical and the conclusion inverts.
The same applies within a single market across categories. Fifty thousand searches is good in Electronics. A thousand can be excellent in industrial and scientific tools, where the buyers are few and the order values are not. Any volume figure read without knowing the size of the pond it came from is a decoration.
This is where a keyword tool earns its cost, because the useful output is not the raw figure but the figure in context. A good read on Amazon search volume pairs the number with what surrounds it: how the term’s traffic distributes across the listings already ranking, whether the leaders are entrenched, and whether the number is moving.
The Winnability Discount
The last reading is the one that turns volume into strategy.
A keyword might show 50,000 searches while the top ten results all carry 20,000-plus reviews. That is not an opportunity, it is a wall with a number painted on it. The volume is real and entirely unavailable to you.
The arithmetic that follows is straightforward and widely ignored. If you can dominate ten keywords at 500 searches each, you have 5,000 searches of genuinely addressable demand. If you fail to crack the top twenty on one keyword at 5,000, you have none. The second option looks better in a spreadsheet and pays nothing.
A workable scoring model is three axes out of five: demand, relevance, and ability to win. A term scoring 5, 5 and 2 totals 12 out of 15 and should be treated with suspicion, because the axis it fails is the one that determines whether the other two ever apply.
One last caution about the figures themselves. Because every volume number is modeled rather than measured, precision claims made for them deserve scrutiny. The FTC’s advertising and marketing guidance is direct that claims must be truthful and evidence-based and that companies have to be able to support them, which applies to a tool vendor’s accuracy claims as much as to a product listing. Treat a volume figure quoted to the nearest unit as a presentation choice, not a measurement.
Building the List
A practical target list runs 50 to 100 keywords in three tiers: one primary term above 10,000, roughly five support terms between 2,000 and 5,000, and ten or more long-tails under 1,000.
Note the shape. The long-tails outnumber everything else, and collectively they usually deliver more addressable demand than the primary term does, at a fraction of the cost to rank. The primary term is there to be aimed at over years, not won in a quarter.
When a whole category appears to move at once, check it against something outside your own account before reacting. The Census Bureau’s Monthly Retail Trade Survey publishes the equivalent reading at the whole-economy level, which is a cheap way to tell a genuine seasonal swing from an artifact of your own listings going in or out of stock.
Pull your current listing’s top five terms and write the 30-day and 12-month figures side by side. Where the two diverge sharply, you have either a seasonal term you are treating as evergreen or a growing one you are underinvesting in. Both are worth an afternoon.

